
The World Bank's Remittance Prices Worldwide report for Q3 2023 puts the average cost of sending money across African borders at 8.9% — the highest of any region on earth. Finance directors at companies operating across multiple African markets tend to nod at that number and move on, because their own transfer fee line items look nothing like 8.9%. They see 2%, maybe 3%. They assume they have solved the problem.
They have not. Analysts at Stears and TechCabal have found that businesses operating across multiple African markets typically underestimate their true cost of cross-border payments by 40 to 60% when they look only at the stated transfer fee. The rest of the cost is real, it is recurring, and it is sitting in line items that most finance teams are not treating as payment costs at all.
The African Development Bank estimates that Africa loses over $5 billion annually to excessive cross-border transaction costs. A meaningful share of that is not theft by bad actors or failure by governments — it is the accumulated result of finance teams reporting an incomplete number and building their treasury strategy around it.
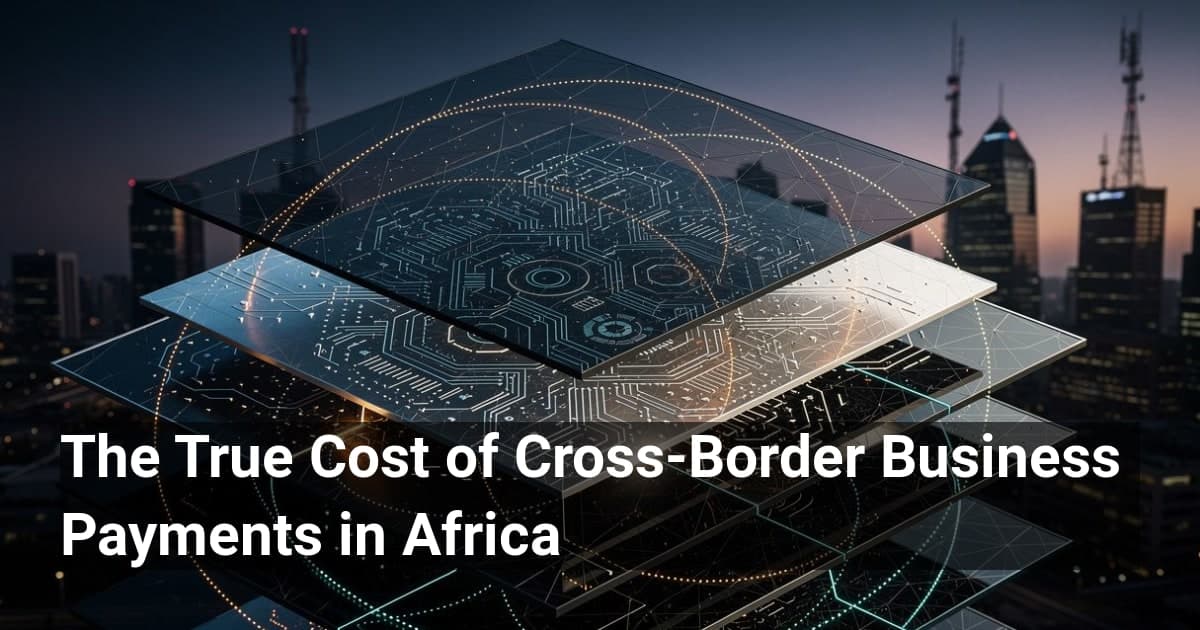
Five layers, one true cost
Cross-border B2B payments in Africa do not have one cost. They have five, and most finance teams are only counting the first one.
The first layer is the stated transfer fee — the number on the invoice from your bank or payment provider. This is the only figure most teams report internally. It looks reasonable. It is not the full picture.
The second layer is the FX spread markup. When your provider converts naira to Kenyan shillings, they use an exchange rate. That rate is rarely the mid-market rate you see on Google. The markup is typically 1.5 to 3 percentage points above mid-market, and it is embedded silently in the conversion. No line item. No disclosure. Just a slightly worse rate than you could have gotten, on every single transaction.
The third layer is correspondent banking charges. Africa has 42 currencies and no unified settlement infrastructure that covers the continent. A payment from Nigeria to Kenya does not travel directly — it routes through an intermediary bank, often in New York or London, before arriving in Nairobi. Each intermediary takes a lifting fee. Correspondent banking relationships in Africa declined by over 20% between 2011 and 2022, according to BIS and World Bank data, which means fewer intermediaries handling more volume at higher prices.
The fourth layer is receiving bank charges. The bank on the other end often deducts its own fee before the funds reach your supplier or counterparty. This is the cost that causes the most friction in supplier relationships, because the amount that arrives is not the amount that was sent, and no one told the recipient why.
The fifth layer is the one that never appears in a payments report at all: reconciliation labor cost. Someone on your finance team is spending hours every week matching cross-border transactions, chasing confirmations, investigating failed payments, and manually updating your ERP. That time has a cost. For businesses running payments across three or more African markets, the operational overhead of manual reconciliation is not a footnote — it is a significant and entirely avoidable expense.
Why the infrastructure makes this worse than it should be
Africa's payment fragmentation is not a mystery. Forty-two currencies across 54 countries, with regulatory regimes that do not speak to each other, and a correspondent banking network that has been contracting for a decade. The structural result is that most intra-African payments travel further than they need to — geographically and financially.
The corridors that matter most for intra-African trade are among the world's most expensive. South Africa to Zimbabwe. Nigeria to Ghana. These are not obscure routes — they are the arteries of regional commerce, and they consistently rank among the priciest globally in World Bank data.
The Pan-African Payment and Settlement System — PAPSS — is the most serious institutional attempt to change this. Backed by Afreximbank and the African Union, and positioned as the payment backbone of the African Continental Free Trade Area, PAPSS went live in West Africa and has been expanding its live corridors through 2023 and 2024. Its premise is direct: enable real-time, local-currency settlement between African countries without routing through New York or London. The cost reduction potential is structural, not incremental, because it removes entire layers of the cost stack rather than discounting within them.
Intra-African trade currently accounts for only 15 to 18% of Africa's total trade, compared to over 60% in Europe. Payment friction is one of the documented structural barriers. PAPSS does not solve this alone, but it creates the rails on which a different kind of intra-African commerce becomes possible.
What a cost audit actually looks like
The five-layer framework is not theoretical. It is a practical audit that any finance director can run against their last 90 days of cross-border payment data.
Start with your stated fees — pull every cross-border transaction and total the transfer fees reported. Then request the exchange rates applied to each transaction and compare them to the mid-market rate on the date of transfer. The gap, multiplied across your transaction volume, is your FX spread cost. Add any correspondent bank lifting fees visible in your SWIFT messages. Add receiving bank deductions reported by your counterparties. Finally, estimate the hours your finance team spent on cross-border reconciliation in the period and assign a labor cost.
Most finance teams who run this exercise for the first time find the number is 40 to 60% higher than what they had been reporting. That gap is the opportunity.
The reduction levers are known: use fintech platforms that access local payment rails and offer transparent mid-market FX rates rather than opaque markups; hold and pay in local currencies through multi-currency virtual accounts where available; batch payments to reduce per-transaction overhead; and integrate payment infrastructure directly into your ERP or accounting system to eliminate the reconciliation labor cost entirely.
Flutterwave processed over $26 billion in transactions in 2023. The broader African B2B cross-border payments market is projected to grow past $40 billion in processed volume by 2025. The demand is not the question. The question is whether the infrastructure serving that demand is built to show businesses what they are actually paying — and to charge them less for it.
Mydappr's payment infrastructure is built around this exact problem: not to be one more transfer tool with a competitive headline fee, but to collapse the full cost stack — local rails where they exist, mid-market FX with no hidden markup, and automated reconciliation that removes the fifth layer entirely. The goal is not a better rate. It is an honest one.